
TNK
-
Posts
7 -
Joined
-
Last visited
Everything posted by TNK
-
Do you have data regarding the seat on the row? I feel that an lateral seat really makes a difference compared to a middle seat, not only because of the better view, but also because of the G forces. What are you trying to do with the data? Are you going to make it public, or publish it?
-
Dragon Challenge: Hungarian Horntail elements in the ride: Please correct me if I am wrong! 1. start moving 2. start climbing the hill 3. 0g loop 4,5,7,8 kinetic energy is used (breaking, red) to spin the train (lateral g, blue) 6. break 9. final break 10, 11 breaks 12. final stop 40 seconds, total ride time.

-
What you are saying is true, but I don't thing that there are any conclusions to be made based on a single graph. I think that the variation is insignificant among all the other forces involved. It would be very interesting to get data in an consistent way, a few samples from the front seat, a few from the middle and a few from the back, and compare them. I went on Manta the other day, on the back seat, and it was amazing. Front row is definitely overrated.
-
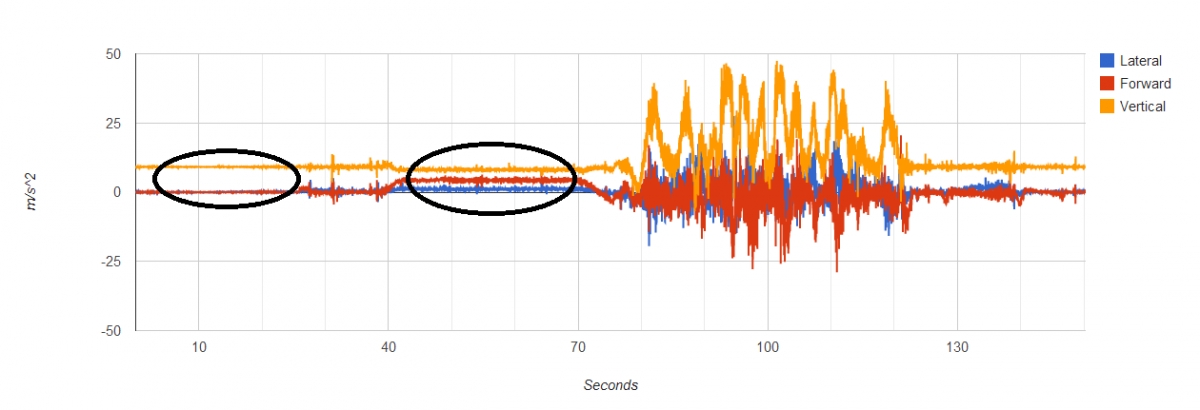
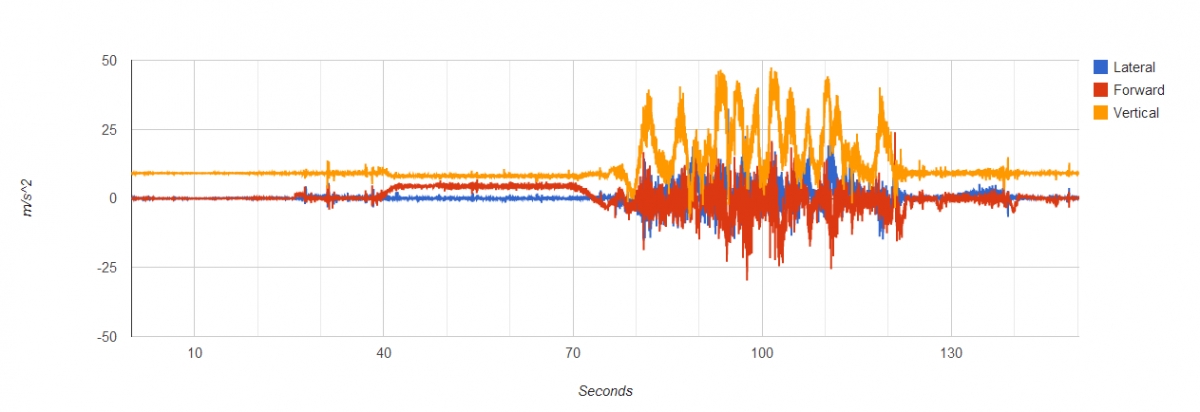
It is really easy to do the rotation of the measuring device and to do some basic noise reduction. You only need some spreadsheet calculations. To rotate the coordinates of the measuring device take a look here http://www.mathematics-online.org/inhalt/aussage/aussage444/. That is the rotation in a single plane. Since you have 3 dimensions, you have to apply the transformation 3 times. I will go step by step explaining how I got the graph for another IOA coaster Dragon Challenge: Hungarian Horntail Imagine that your measuring device is an cube withe 3 axes: forward, lateral and vertical, and you want to rotate it in the right position This is my raw data: Notice how in some places the vertical acceleration hit a limit at about 40 m/s^2, that is because the sensor in my Nexus 4 has a maximum range of 39.22 m/s^2, that is 4g, with g considered at 9.805 At the beginning of the graph the gravitational acceleration has components on all 3 axis of the sensor, more on the lateral, and less on the forward. Using the formula here http://www.mathematics-online.org/inhalt/aussage/aussage444/, I rotated the device around it's lateral axis, until the forward axis was on the horizontal plane, so the gravitational component on it would be 0. Because of the noise, I used an average value to find the rotation angle. The lateral component is unchanged, only the forward and vertical components are changed. I did the same exact thing for the the lateral axis, I rotated the device around it's forward axis. This time the forward axis is unchanged, and the lateral axis becomes 0, transferring it's gravitational component to the vertical axis. Notice how the fact that the device clipped at measuring the full acceleration is not evident anymore. When stationary, the gravitational acceleration is 0 on both lateral and forward axis But the device is still not "straight", when the train is going forward, the acceleration is split in two components, between the forward and the lateral, but not on the vertical, we already ensured that the vertical is really "vertical". On the hill, even at constant speed, the gravitational pull is spitted between the vertical, the forward and the lateral. This is the opportunity to rotate the device one more time, so the gravitational pull has no lateral component. I rotated the device around the vertical axis, at an angle that the lateral acceleration is 0 while the train is climbing the hill. This time, since the train is moving, there is even more noise, so it is even more important to use an average value when calculating the right angle of rotation. Now I calculated each point as the average of the previous 10 values, noise reduction. And as the average of the previous 20 values, a more aggressive noise reduction. I hope I was clear enough, if you need help, or I haven't explained something properly, please let me know.
-
I used https://play.google.com/store/apps/details?id=com.lul.accelerometer&hl=en on my Nexus 4. Every point plotted is an average of 10 readings. One reading was taken every 20 ms. Graph was done using google docs. Are your logs available anywhere? What accelerometer did you use? How is it connected to the ride? I think normalization is pretty important, and is not hard to do.
-
I don't see how forward acceleration can be influenced greatly by the seat on the ride. There are 5 distinct changes in the forward acceleration: 1: the train leaves 2: ascending part (because the inclination changes the gravitational acceleration component is present on the movement direction) 3: launch 4: first stop 5: complete stop
-
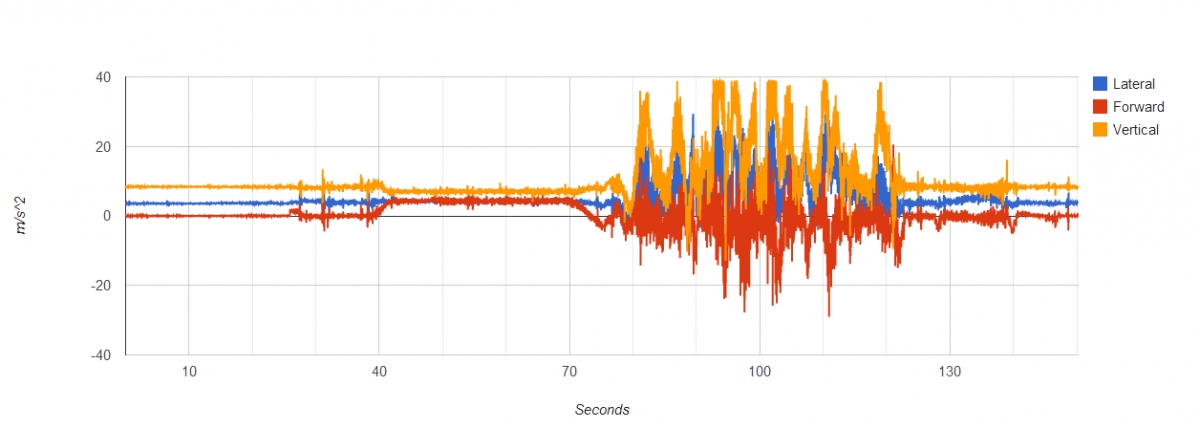
I have recently been to Universal IOA and rode Hulk. I have recorded the acceleration using my phone. After a bit of data processing (normalizing the axes) I got this graph. I have 10 different readings, this is just one of them. There are lots of error sources, including a few samples that are clipped (acceleration was over the sensor limit). I do have data for the blue track of the Dragon Challenge, Manta and Kraken, but I haven't looked at it yet. A few observations: Maximum total acceleration: about 3.5G Maximum lateral acceleration: less than 1G Maximum forward acceleration: a bit over 1.5G (at launch) Actual ride length: about 45 seconds I am wondering if this was done before